Home » Scientific research progress

-
Abstract
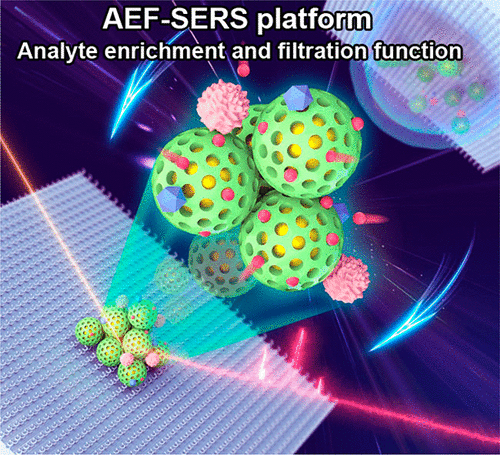
Surface-enhanced Raman scattering (SERS) technique with naturally born analyte identification capability can achieve ultrahigh sensitivity. However, the sensitivity and quantification capability of SERS are assumed to be mutually exclusive. Here, we prohibit the formation of the ultrasensitive SERS sites to achieve a high quantification capability through separating the gold (Au) nanorods from approaching each other with thick metal organic framework (MOF) shells. The sensitivity decrease caused by the absence of the ultrasensitive SERS sites is compensated by the analyte enrichment function of a slippery surface. The porous MOF shell around the Au nanorod only allows analytes smaller than the pore size to approach the Au nanorods and contribute to the SERS spectrum within the complex sample, greatly enhancing the analyte identification capability. Overall, we have demonstrated an integrated SERS platform with analyte enrichment and analyte filtration function, realizing sensitive, quantitative, and size selective analyte identification in complex environments.
-
-
KEYWORDS:
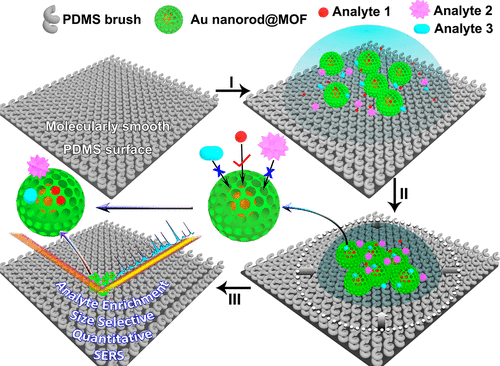
Figure 1. Schematic of the working principle of the AEF-SERS platform. Process I: Applying the liquid sample and Au nanorod@MOF particles onto the PDMS brush surface. Process II: Analyte molecules and the Au nanorod@MOF particles are concentrated during solvent evaporation. Only those analyte molecules smaller than the aperture size of the MOF shell acting as an analyte filter can pass through, reach the inside Au nanorod, and contribute to the SERS spectrum. Process III: Analyte molecules and Au nanorod@MOF particles form a tiny aggregate after the solvent completely evaporates.
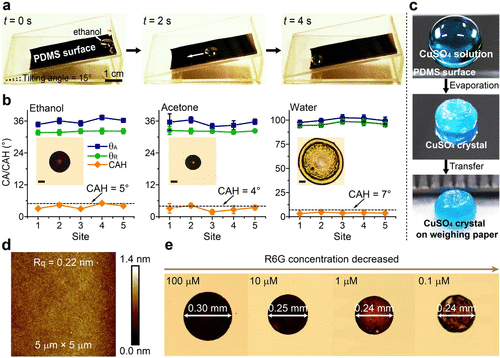
Figure 2. Wetting properties of the molecularly smooth PDMS brush surface. (a) An ethanol droplet (5 ��L) slides on the PDMS brush surface. (b) The advancing and the receding angle, as well as the CAH of 10 ��L of ethanol, acetone, and water droplet on the molecularly smooth PDMS brush surface. Insets: aggregates formed on the PDMS brush surface after 10 ��L of 1 mM R6G ethanol, acetone, and water solutions completely evaporate, respectively. Scale bar: 0.1 mm. (c) A CuSO4 crystal is formed on the PDMS brush surface after water evaporates. The weight of the crystal is almost the same as (97.8 �� 1.5%) the amount dissolved into the water droplet. The standard deviation is obtained on five independent measurements. (d) Topographic image of the PDMS brush surface characterized by the AFM measurement, indicating a molecular level smoothness. (e) Aggregates formed after evaporating 10 ��L of R6G ethanol solutions at concentrations ranging from 100 to 0.1 ��M.
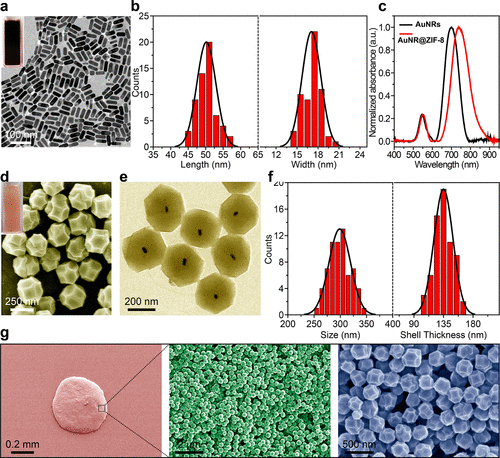
Figure 3. Characterization of the AuNRs, AuNR@ZIF-8 TRDs, and the AuNR@ZIF-8 TRD aggregate formed on the molecularly smooth PDMS brush surface. (a) SEM image of the AuNRs. Inset: Photograph of the AuNR colloid. (b) The length (50.20 �� 2.72 nm) and the width (17.07 �� 1.36 nm) distribution of the AuNRs. The error bars are obtained based on 58 AuNRs. (c) UV�Cvis absorption spectra of AuNR and AuNR@ZIF-8 TRD colloid. (d) SEM image of AuNR@ZIF-8 TRDs. Inset: Photograph of the AuNR@ZIF-8 TRD colloid. (e) TEM image of the AuNR@ZIF-8 TRDs. (f) Size (298.93 �� 20.66 nm) and the shell thickness (134.95 �� 14.57 nm) distribution of the AuNR@ZIF-8 TRDs. The error bars are obtained based on 65 particles. (g) AuNR@ZIF-8 TRD aggregate formed on the PDMS brush surface.

Figure 4. Evaluation of the quantification capability and the sensitivity of the AEF-SERS platform. (a) SERS spectra of 4-NBT at different concentrations using AuNRs on the PDMS brush surface. Inset: The molecular structure of 4-NBT. (b) The relationship between the intensity of the 1329 cm�C1 SERS peak and the concentration of 4-NBT. The error bars are obtained based on 40 SERS spectra. (c) SERS spectra of 4-NBT at different concentrations using AuNR@ZIF-8 TRDs on the PDMS brush surface. (d) The relationship between the intensity of the 1329 cm�C1 SERS peak and the concentration of 4-NBT. The error bars are obtained based on five SERS spectra. SERS mapping results of the 1329 cm�C1 SERS peak from 10 nM 4-NBT when using AuNRs (e) and the AuNR@ZIF-8 TRDs (f), respectively. Intensity variations of the 1329 cm�C1 SERS peak from randomly chosen 40 SERS spectra when using AuNRs (g) and the AuNR@ZIF-8 TRDs (h), respectively.
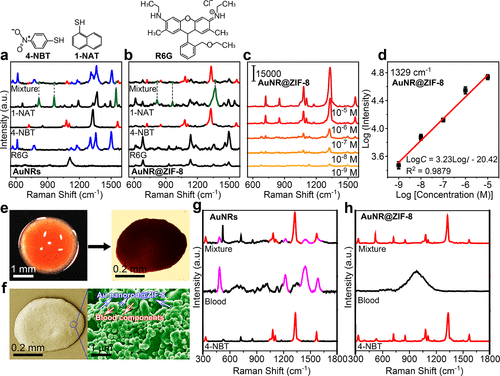
Figure 5. The MOF shell as an analyte filter to enhance the analyte identification capability. (a) SERS spectra of R6G, 4-NBT, 1-NAT and their mixture at 10 nM concentration when using AuNRs on the PDMS brush surface. Raman spectrum of the AuNRs was also shown. Inset: Molecular structures of 4-NBT and 1-NAT. (b) SERS spectra of 4-NBT, 1-NAT and their mixture at 10 nM concentration when using AuNR@ZIF-8 TRDs on the PDMS brush surface. Inset: Molecular structure of R6G. (c) SERS spectra of the mixture of R6G, 4-NBT, and 1-NAT at different concentrations using the AuNR@ZIF-8 TRDs. (d) The intensity of the 1329 cm�C1 SERS peak of 4-NBT in the mixture as a function of its concentration. (e) Evaporation of 10 ��L of blood droplet introduced with 4-NBT and AuNR@ZIF-8 TRDs on the PDMS brush surface. (f) The corresponding aggregate composed of AuNR@ZIF-8 TRDs and complex blood components. (g,h) SERS spectra of the whole blood, and the mixture of the whole blood and 10 nM 4-NBT using AuNRs and AuNR@ZIF-8 TRDs as SERS substrates on the PDMS brush surface, respectively. The standard Raman spectrum of 4-NBT is shown in (g,h).
Conclusion
In summary, we constructed an AEF-SERS platform capable of sensitively and quantitatively identifying analytes in complex environments. By incorporating the powerful PDMS analyte enrichment surface into the SERS sensors, the sensitivity and the quantification capability, the two previously deemed mutually exclusive properties can be improved simultaneously. The porous MOF shells can selectively allow those analytes of interest to contribute to the SERS spectrum, greatly simplifying the SERS spectrum and strengthening the analyte identification capability in complex samples. We demonstrated selective detection of 4-NBT at nanomolar concentration levels from the whole blood. Overall, the AEF-SERS system has a high sensitivity, a strong quantification capability, and enhanced analyte identification ability which will find exciting applications in analytical chemistry, environmental pollution detection, food safety, and biomedical fields (e.g., detection of biomarkers in biofluids) through designing the aperture size of the MOF shells.
Website��https://pubs.acs.org/doi/10.1021/acs.nanolett.0c02683